Table of Contents
ToggleData & Analytics
In the era of digital transformation, data has become the new oil, an invaluable resource driving innovation, efficiency, and strategic decision-making. Data & Analytics (D&A) is the discipline of gathering, processing, and analysing data to uncover meaningful insights that can lead to informed actions. Organizations that leverage D&A effectively are outperforming their peers, making smarter business decisions, and staying ahead in competitive markets.
What is Data & Analytics?
Data refers to raw facts and figures collected from various sources—websites, sensors, social media, transactions, mobile devices, and more.
Analytics is the process of interpreting this data using statistical methods, algorithms, and software tools to identify patterns, trends, and relationships.
Together, data & analytics help organizations transform information into actionable intelligence.
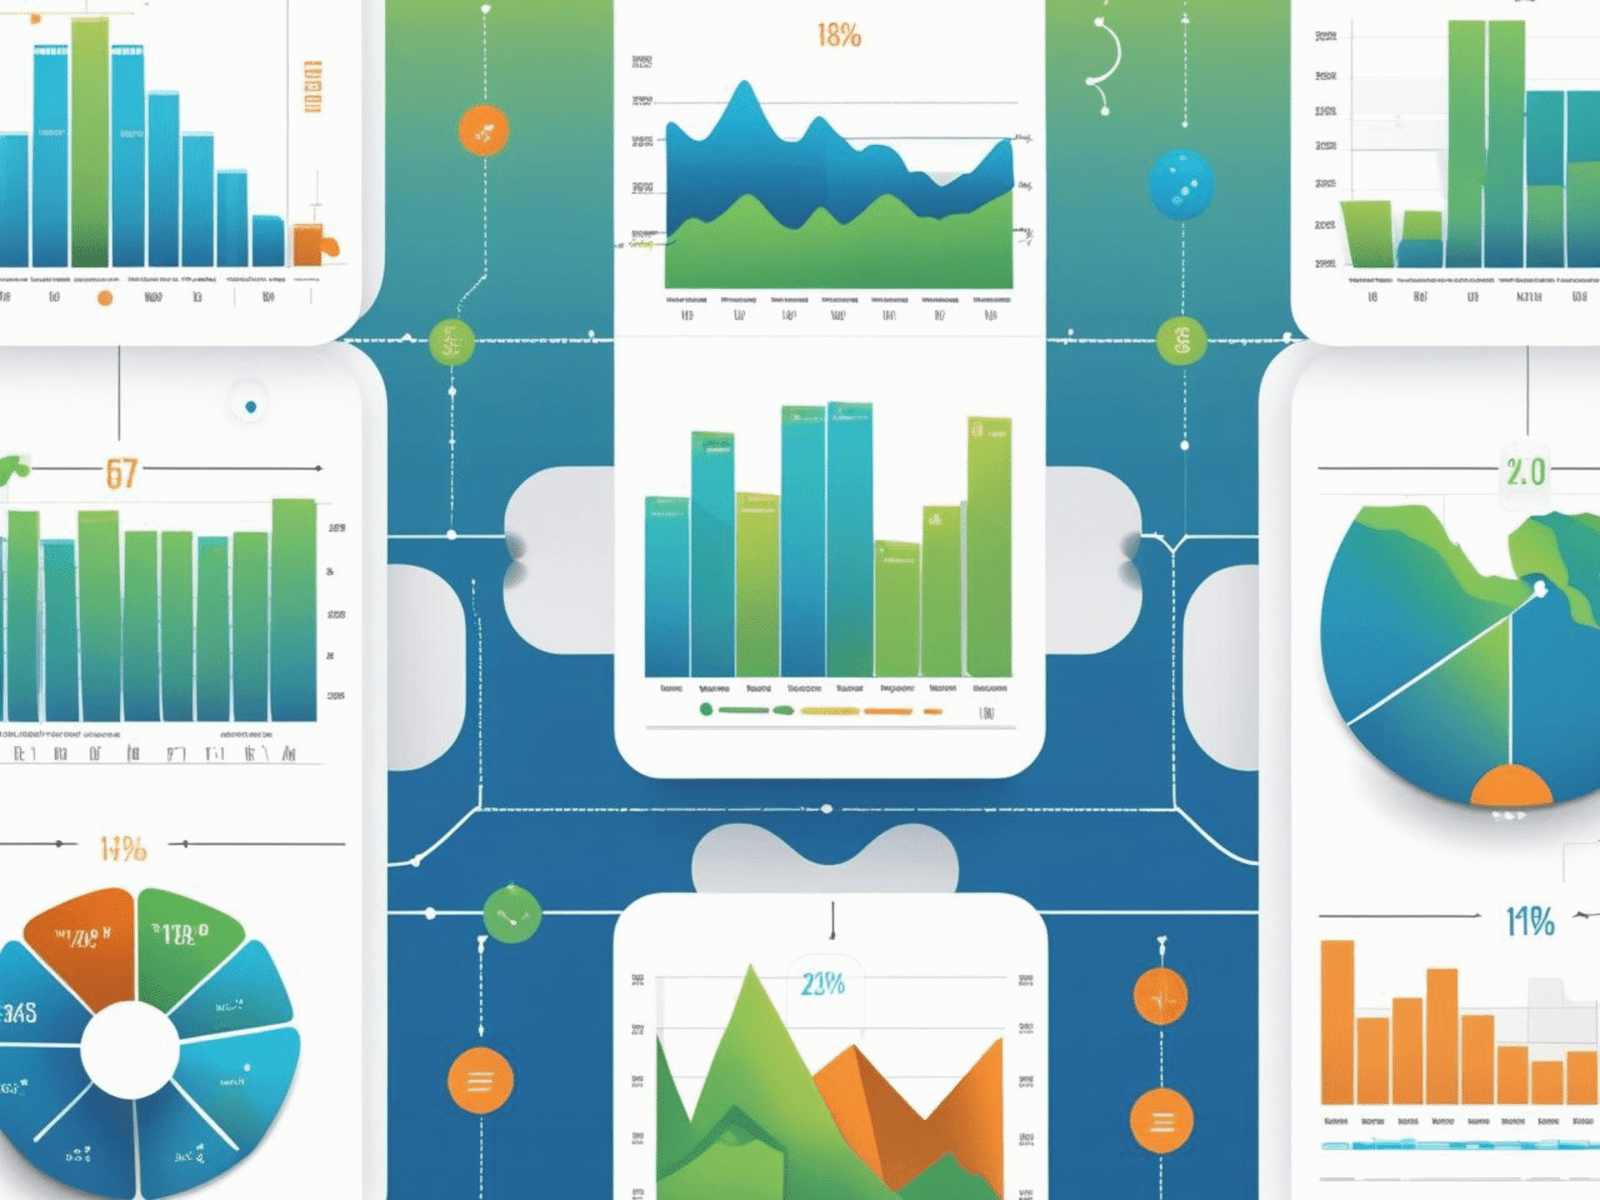
Types of Data Analytics
Descriptive Analytics
Descriptive Analytics is a type of data analytics that focuses on summarising and interpreting historical data to understand what has happened in the past.
What It Does:
Uses tools and techniques like data aggregation, data mining, and data visualisation.
Helps in identifying patterns, trends, and relationships in historical data.
Examples:
Monthly sales reports
Customer satisfaction scores over the past year
Social media engagement analytics
Output Format:
Charts
Graphs
Dashboards
Tables
Purpose:
Descriptive analytics provides a baseline understanding of business performance, helping organisations make informed decisions based on past data.
Diagnostic Analytics
Definition:
Diagnostic analytics focuses on identifying the root causes of past events or trends by drilling deeper into historical data. It uses techniques like data discovery, data mining, drill-down, and correlations to understand patterns and relationships.
Predictive Analytics
Predictive Analytics is a branch of data analytics that uses historical data, statistical algorithms, and machine learning techniques to predict future outcomes or trends.
Key Components of Predictive Analytics:
Historical Data: Information from past events (e.g., sales records, website traffic, customer behaviour).
Statistical Modelling: Techniques like regression analysis or time series forecasting are used to identify relationships.
Machine Learning: Algorithms that can learn from data and improve predictions over time.
How Predictive Analytics Works:
Data Collection: Gather data from different sources (databases, logs, sensors, etc.).
Model Building: Use algorithms (like decision trees, neural networks, or random forests) to train a model.
Prediction: Apply the model to new or future data to forecast outcomes.
Real-World Examples:
Retail: Predict what products a customer will buy next.
Manufacturing: Predict machine failure to schedule maintenance.
Benefits:
Better decision-making
Cost savings
Improved customer experience
Prescriptive Analytics
Definition:
Prescriptive analytics uses mathematical models, machine learning, optimisation algorithms, and business rules to suggest decisions or actions that will lead to desired outcomes.
How it works:
Prescriptive analytics typically involves:
Data Collection—From various sources (sales, customer behaviour, sensors, etc.).
Predictive Modelling—To forecast possible future scenarios.
Decision Modelling—To determine the best course of action among many options.
Optimization—To find the most efficient or profitable outcome.
Example Use Cases:
Supply Chain: Recommending the optimal inventory levels or delivery routes.
Monetary: Providing investment recommendations or fraud prevention actions.
Benefits:
Better decision-making.
Increased efficiency.
Importance of Data & Analytics
Informed Decision-Making: Data-driven decisions reduce guesswork and lead to better outcomes.
Operational Efficiency: Analysing workflows and operations reveals inefficiencies and cost-saving opportunities.
Customer Insights: Understanding customer behaviour enables personalized experiences and better service.
Risk Management: Early identification of risks through data helps in proactive mitigation.
Innovation: Insights from data spark new ideas for products, services, and business models.
Applications Across Industries
Monetary: Fraud detection, credit scoring, investment analysis.
Retail: Inventory management, customer segmentation, pricing strategies.
Manufacturing: Quality control, predictive maintenance, and supply chain optimization.
Technologies Enabling Dataand Analytics
Big Data Platforms
Cloud Computing
Business Intelligence Tools
Artificial Intelligence & Machine Learning
Data Warehousing & ETL Tools
Challenges in Data & Analytics
Data Privacy and Security: Ensuring compliance with regulations like GDPR.
Data Quality: Inaccurate or incomplete data can lead to poor insights.
Integration Issues: Combining data from multiple sources can be complex.
Skill Gaps: Shortage of skilled data scientists and analysts.
Future Trends
Augmented Analytics: AI automating parts of the analysis process.
Real-Time Analytics: Instant insights for faster decisions.
Data Democratisation: Making data accessible to non-technical users.
Ethical AI & Analytics: Ensuring transparency and fairness in algorithms.
Conclusion
Data & Analytics is more than just a technological tool—it’s a strategic asset that transforms how businesses operate and compete. In a data-driven world, those who invest in strong D&A capabilities are not just keeping up—they’re leading the way.
Data Fabric: A New Era of Data Management
In today’s rapidly evolving digital landscape, data is the lifeblood of modern organizations. With the explosion of big data, cloud computing, Internet of Things (IoT), and artificial intelligence (AI), businesses are managing more data than ever before. However, this also brings significant challenges—data is often scattered across multiple systems, locations, and formats. To tackle this complexity, a new architectural approach has emerged: Data Fabric.
What is Data Fabric?
Data Fabric is a unified architecture and set of data services that provide consistent capabilities across various endpoints—on-premises, cloud, hybrid, and edge environments. Its goal is to simplify and integrate data management processes by enabling seamless access, sharing, and governance of data across disparate systems.
Imagine it as an intelligent “fabric” woven across all data sources and environments, automatically connecting data wherever it resides. Unlike traditional data management methods that rely on centralising data in warehouses or lakes, Data Fabric enables data virtualisation, real-time integration, and automation across a distributed ecosystem.
Key Features of Data Fabric
Unified Data Access
It provides a single view and access point for data across multiple platforms and sources, improving efficiency and reducing silos.
AI-Powered Automation
Machine learning algorithms are integrated to automate data discovery, classification, and policy enforcement, reducing manual work and errors.
Metadata-Driven Architecture
Data Fabric heavily relies on metadata (data about data) to track where data lives, how it moves, and how it is used, enabling smart data orchestration.
Real-Time Data Processing
Supports streaming and event-driven architecture, enabling real-time insights and decision-making.
Benefits of Data Fabric
Increased Agility: Businesses can adapt quickly by accessing and integrating new data sources without major reengineering.
Enhanced Data Quality: With consistent governance and metadata, organisations can maintain higher data integrity and reliability.
Lower Costs: By avoiding costly data duplication and centralisation, and through automation, operational costs are reduced.
Quick Insights: Real-time integration and analytics across diverse systems lead to quicker, more informed business decisions.
Applications of Data Fabric
Finance: Unifying customer data from multiple banking systems to detect fraud and personalize services.
Retail: Connecting supply chain, sales, and customer data for dynamic pricing and inventory management.
Telecommunications: Managing massive volumes of network and customer data across hybrid environments for predictive maintenance and service optimization.
Challenges and Considerations
While Data Fabric offers many advantages, it also presents challenges:
Implementation Complexity: Setting up a data fabric requires deep expertise in data architecture and governance.
Tool Compatibility: Integrating legacy systems with modern fabric platforms can be difficult.
Security Risks: With more access points comes the need for stronger cybersecurity frameworks.
However, with careful planning and the right technology partners, these challenges can be effectively managed.
Future of Data Fabric
As data continues to grow in volume, variety, and velocity, the need for smarter data integration and management solutions becomes more critical. Data Fabric is poised to be a cornerstone of next-generation data strategies, especially in AI-driven organizations.
According to Gartner, by 2026, over 75% of organizations using Data Fabric will significantly reduce time to data delivery and improve data utilization efficiency.
Conclusion
Data Fabric is not just a technology trend—it’s a transformative approach to modern data management. By enabling seamless data connectivity, intelligent automation, and robust governance across complex environments, Data Fabric empowers organizations to unlock the full potential of their data. As we move further into a data-centric world, adopting a data fabric strategy will be essential for businesses aiming to stay competitive and innovative.

